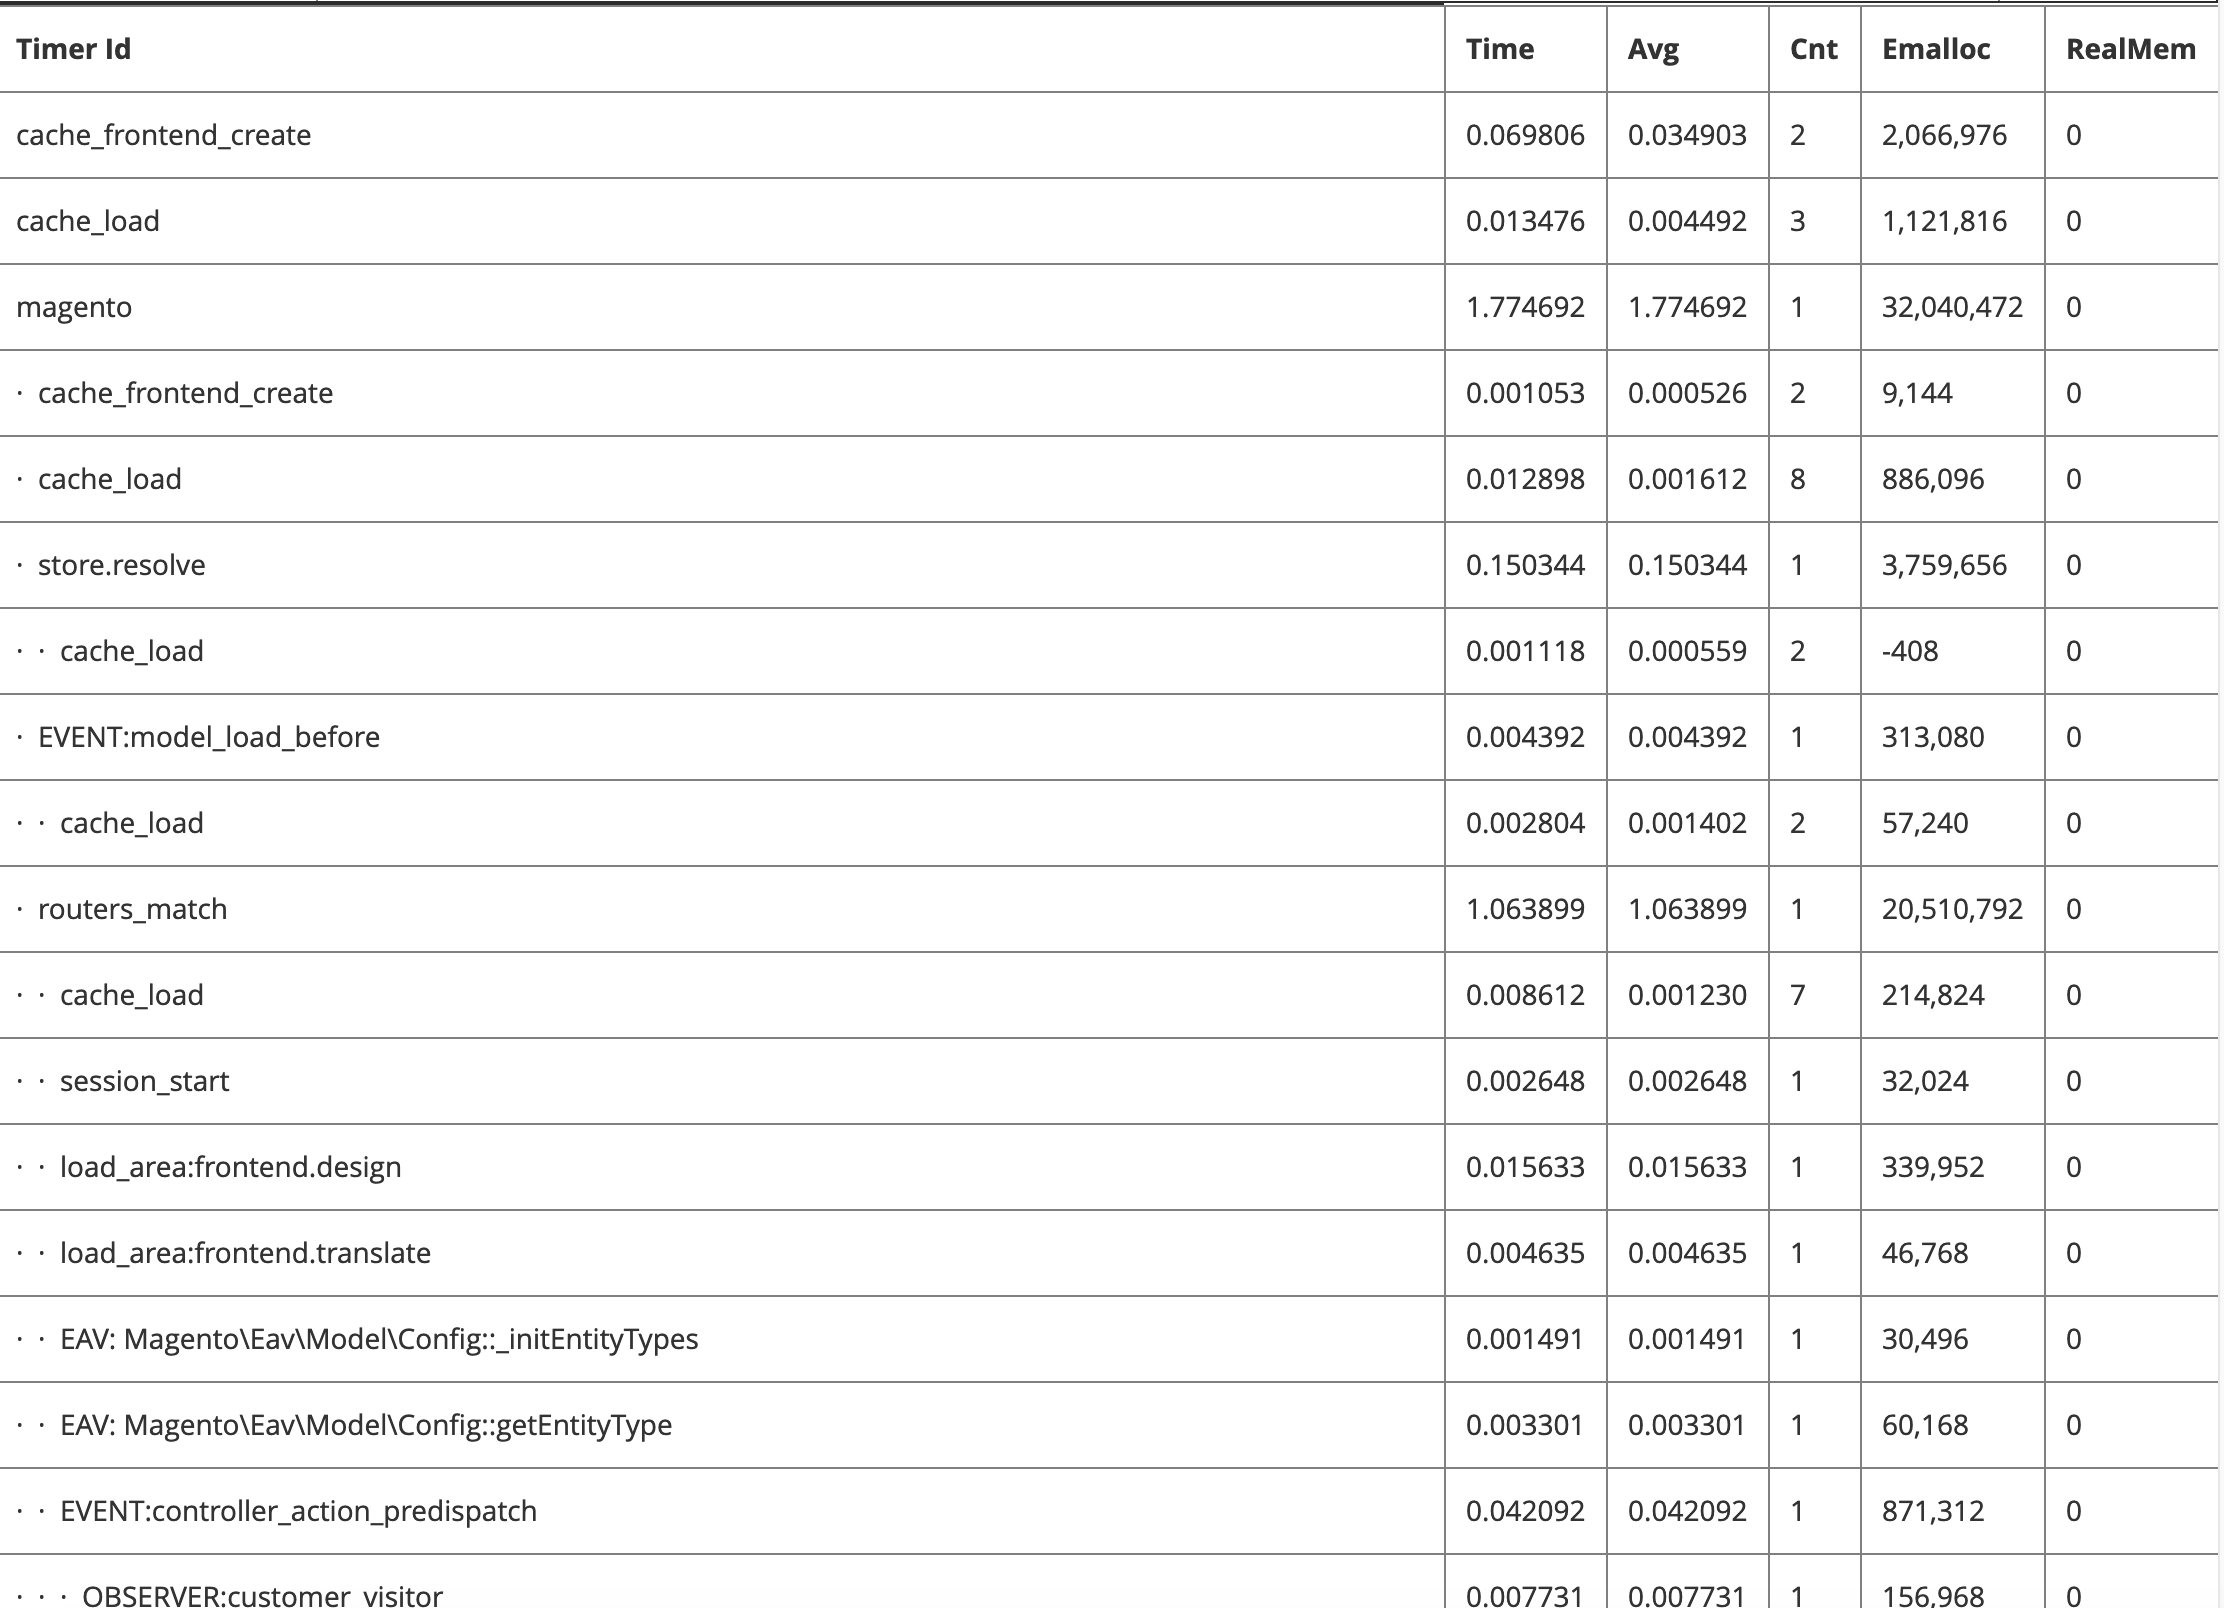
Magento has an in-built profiler that can be used to identify performance problems on the server side. In a nutshell, the profiler can tell us the execution time of certain chunks of code. We always have a scenario to know which template is loaded on the page then this is helpful to debug the layout.
Magento supports three profiler outputs, namely html, csvfile, and firebug.
To enable the profiler, we can edit .htaccess and add one of the following expressions:
- SetEnv MAGE_PROFILER “html”
- SetEnv MAGE_PROFILER “csvfile”
- SetEnv MAGE_PROFILER “firebug”
CLI commands
You can enable or disable the profiler using CLI commands:
dev:profiler:enableenables the profiler withtypeofhtml(default) orcsvfile. When enabled, a flagfilevar/profiler.flagis created.dev:profiler:disabledisables the profiler. When disabled, the flagfilevar/profiler.flagis removed.
To enable dependency graphs, use the variable option.
To enable or disable the profiler:
- Log in to your Magento server.
- Change to your Magento installation directory.
- As the Magento file system owner, enter the following command to configure the profiler:
To enable the profiler using type html and create a flagfile:
php bin/magento dev:profiler:enable html
Enable database queries profiler
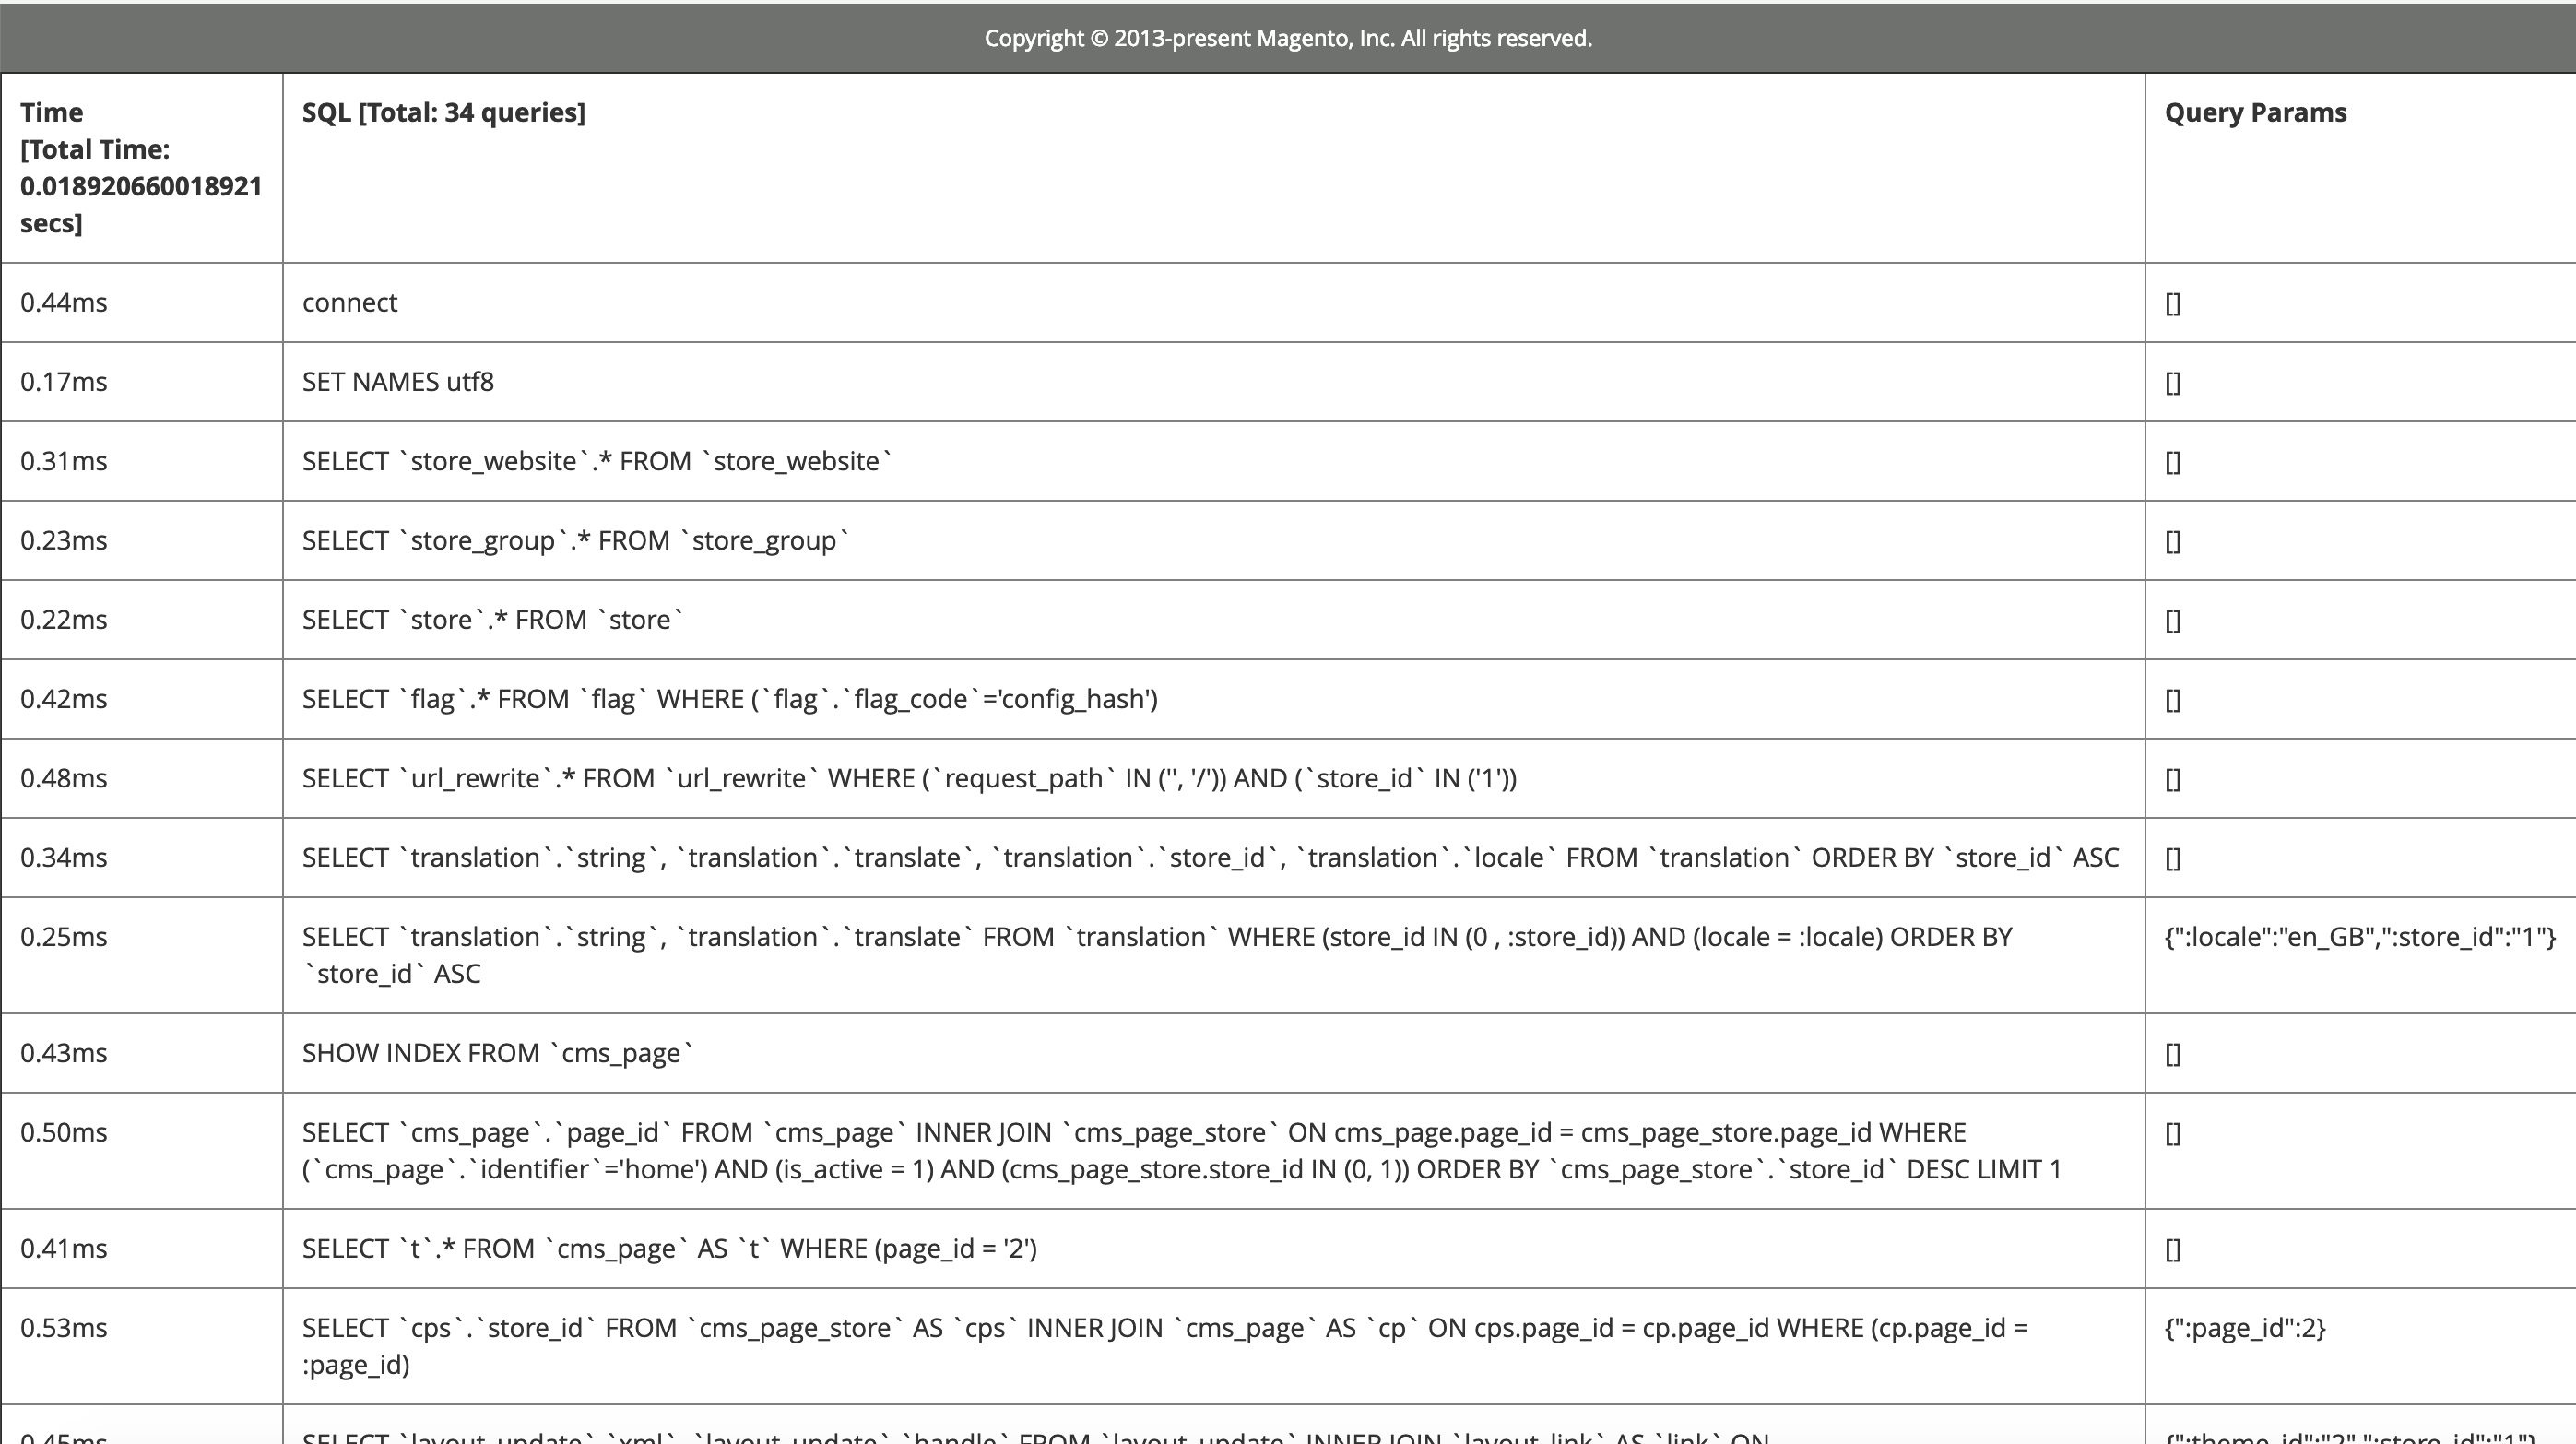
The Magento database profiler displays all queries executed on a page, including the time for each query and what parameters were executed.
Modify /app/etc/env.php to add the following in db connection default setting:
'profiler' => [
            'class' => '\Magento\Framework\DB\Profiler',
            'enabled' => true,
        ],
To configure the output, add the following after the $bootstrap->run($app); line in your <Magento Install Directory>/index.php file:
/** @var \Magento\Framework\App\ResourceConnection $res */
$res = \Magento\Framework\App\ObjectManager::getInstance()->get('Magento\Framework\App\ResourceConnection');
/** @var Magento\Framework\DB\Profiler $profiler */
$profiler = $res->getConnection('read')->getProfiler();
echo "<table cellpadding='0' cellspacing='0' border='1'>";
echo "<tr>";
echo "<th>Time <br/>[Total Time: ".$profiler->getTotalElapsedSecs()." secs]</th>";
echo "<th>SQL [Total: ".$profiler->getTotalNumQueries()." queries]</th>";
echo "<th>Query Params</th>";
echo "</tr>";
foreach ($profiler->getQueryProfiles() as $query) {
    /** @var Zend_Db_Profiler_Query $query*/
    echo '<tr>';
    echo '<td>', number_format(1000 * $query->getElapsedSecs(), 2), 'ms', '</td>';
    echo '<td>', $query->getQuery(), '</td>';
    echo '<td>', json_encode($query->getQueryParams()), '</td>';
    echo '</tr>';
}
echo "</table>";
That’s how it will display on every page.